Over the last few decades public transit agencies have installed CAD/AVL systems on their buses for Computer Aided Dispatch and Automatic Vehicle Location. CAD/AVL systems capture data measurements of the location of the bus, number of passengers, delay, speed and many other variables, often as frequently as every five seconds. The result is a huge trove of data that can provide a wealth of information and insights about the operation of a transit agency. Data in these large quantities, however, always contains a significant number of errors. If charts, graphs and even complete dashboard solutions are based on faulty data they can lead to erroneous conclusions about drive times, speeds, delays, headway and other aspects of transit operation.
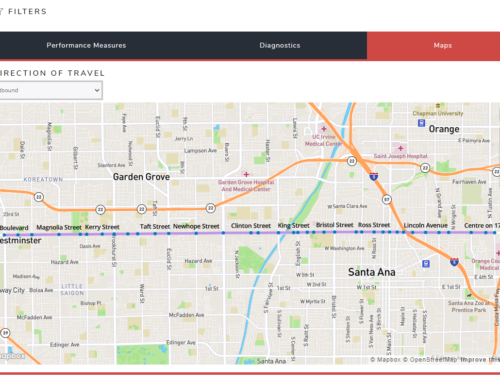
In his presentation “Making Better Transit Planning Decisions by Identifying ITS Data Errors” at APTA TransITech 2018, Moonshadow Mobile’s CEO, Eimar Boesjes, showed how we can identify and eliminate errors in large CAD/AVL files. Moonshadow’s DB4IoT Route Analyst tracks the location of tens of thousands of vehicles from dozens of transit agencies, processing more than ten million movement records per day. Every source data set that we work with contains a significant number of errors. Many of those errors are easily identified and filtered out by visualizing the data over the maps and analytics graphs and charts delivered in DB4IoT Route Analyst GTFS and DB4IoT Route Analyst CAD/AVL.
Download “Making Better Transit Planning Decisions by Identifying ITS Data Errors” here: