DB4IoT Transportation Data for GHG Reporting
DB4IoT Transportation Maps and Spreadsheets for On-Road Transportation.
For use in GHG Inventory Estimates and Evidence-Based Climate Action Planning.
Cities worldwide are combatting climate change by reducing local greenhouse
gas (GHG) emissions. Transportation is among the largest contributors,
amounting to as much as 45% of total emissions in some cities.
Detailed Insight Into Travel Activity Patterns
DB4IoT Transportation Data for GHG Reporting from Moonshadow provides detailed insight into the travel activity patterns in cities, metro areas and counties and can be used by consultants and local governments to gain a deeper understanding of when and where transportation is generating the most emissions.
DB4IoT Transportation Data for GHG Reporting delivers maps and spreadsheets that can be included in Community GHG Inventory Reports, Climate Action Plans and Transportation Plans that consultants prepare for cities, counties, MPOs and DOTs or can be used by local governments themselves to support new policies and plans. Moonshadow uses connected-vehicle data from millions of actual completed trips and/or Location Based Service Data from smart phone apps to generate DB4IoT Transportation Data for GHG Reporting.
More Evidence-Based Information
DB4IoT Transportation Data for GHG Reporting delivers more detailed granular information for creating evidence-based transportation plans to reduce emissions from on-road vehicle transportation. Depending on the data source used the information can include:
- Data per vehicle weight class
- When and where the highest VMT/VKT occurred
- Origin-Destination travel patterns with estimated VMT/VKT values within, to and from the city
- How travel patterns differ on weekdays versus weekends
- How morning peak, evening peak and off-peak travel is different
- Information on travel speeds
Connected-Vehicle Data from Trips that Actually Occurred
Now that connected-vehicle data is available at scale it can be used to make more detailed estimates of vehicle miles traveled (VMT), vehicle kilometers traveled (VKT) and per extension GHG emissions from transportation. The results are derived from connected-vehicle data and trips that actually occurred. The trip data is analyzed using Moonshadow’s powerful DB4IoT database engine. VMT or VKT based on connected-vehicle data can be used to calibrate estimates derived from travel demand models. The data can also be used in conjunction with GHG emissions estimates based on gasoline sales and measuring air quality with sensors. Each method and each approach augments the others in painting a more comprehensive and accurate picture of GHG emissions and each provides different complimentary information on the effectiveness of various climate action plans and GHG reduction plans.
Global Protocol for Community-Scale GHG Emissions Inventories (GPC)
Worldwide there are several protocols and tools available to estimate GHG emissions from on-road transportation. In 2014, the World Resources Institute (WRI), ICLEI – Local Governments for Sustainability and the C40 Cities Climate Leadership Group launched the Global Protocol for Community-Scale GHG Emissions Inventories (GPC) to help cities estimate and report citywide GHG emissions in a robust and consistent way. The US Environmental Protection Agency (EPA) developed a tool called MOVES to estimate state and local inventories of on-road GHG emissions and energy consumption. No matter what tool is used, input of local Vehicle Miles Traveled (VMT) or Vehicle Kilometers Traveled (VKT) is essential to an accurate GHG emissions estimate.
DB4IoT Transportation Data for GHG Reporting provides a set of maps and spreadsheets with detailed VMT or VKT metrics from the vehicles present in the data set. Together with volume count data, this information can be readily used for emissions calculations for on-road vehicles; within a city, to a city and from a city. These three numbers provide a thumbnail sketch of how traffic is contributing to the GHG emissions. In addition DB4IoT Transportation Data for GHG Reporting provides more detailed information about when and where the emissions from traffic are the worst.
Available for Cities in the US, Canada, the EU and UK
DB4IoT Transportation Data for GHG Reporting is available for cities in the US, Canada, EU and UK, and can be purchased as a single-year or multiple-year report. In a multiple-year report detailed local trends become visible. The data will show which traffic patterns between different zones are increasing or decreasing GHG emissions using the same methodology.
The DB4IoT with INRIX Trips cloud-based, interactive trips analytics platform (sold separately) is also available to consultants and local governments to conduct their own additional in-depth analysis such as corridor and road-segment analysis. DB4IoT Route Analyst, an online platform for public transit agencies (sold separately) is also available.
The Data from DB4IoT Transportation Data for GHG Reporting comes as images in jpeg format and CSV Spreadsheets.
Example Maps

Map: Destinations by Relative VMT/VKT. Community: Seattle, WA Year: 2018
All Times Transportation from your Community:
This map shows the relative Vehicle Kilometers Traveled (VKT) for traffic from the City of Seattle to each Destination City. The cities with a low VKT are show in blue and medium VKT cities are shown in purple. Bellevue to the east of Seattle is shown in yellow because it has by far the highest VKT traveled. Only trips that terminate in a city are shown. Trips that do not end in an incorporated city are not visualized and quantified on this map. The City of Seattle itself is shown in the black outline and it is not colored as this map does not include trips inside the Community.
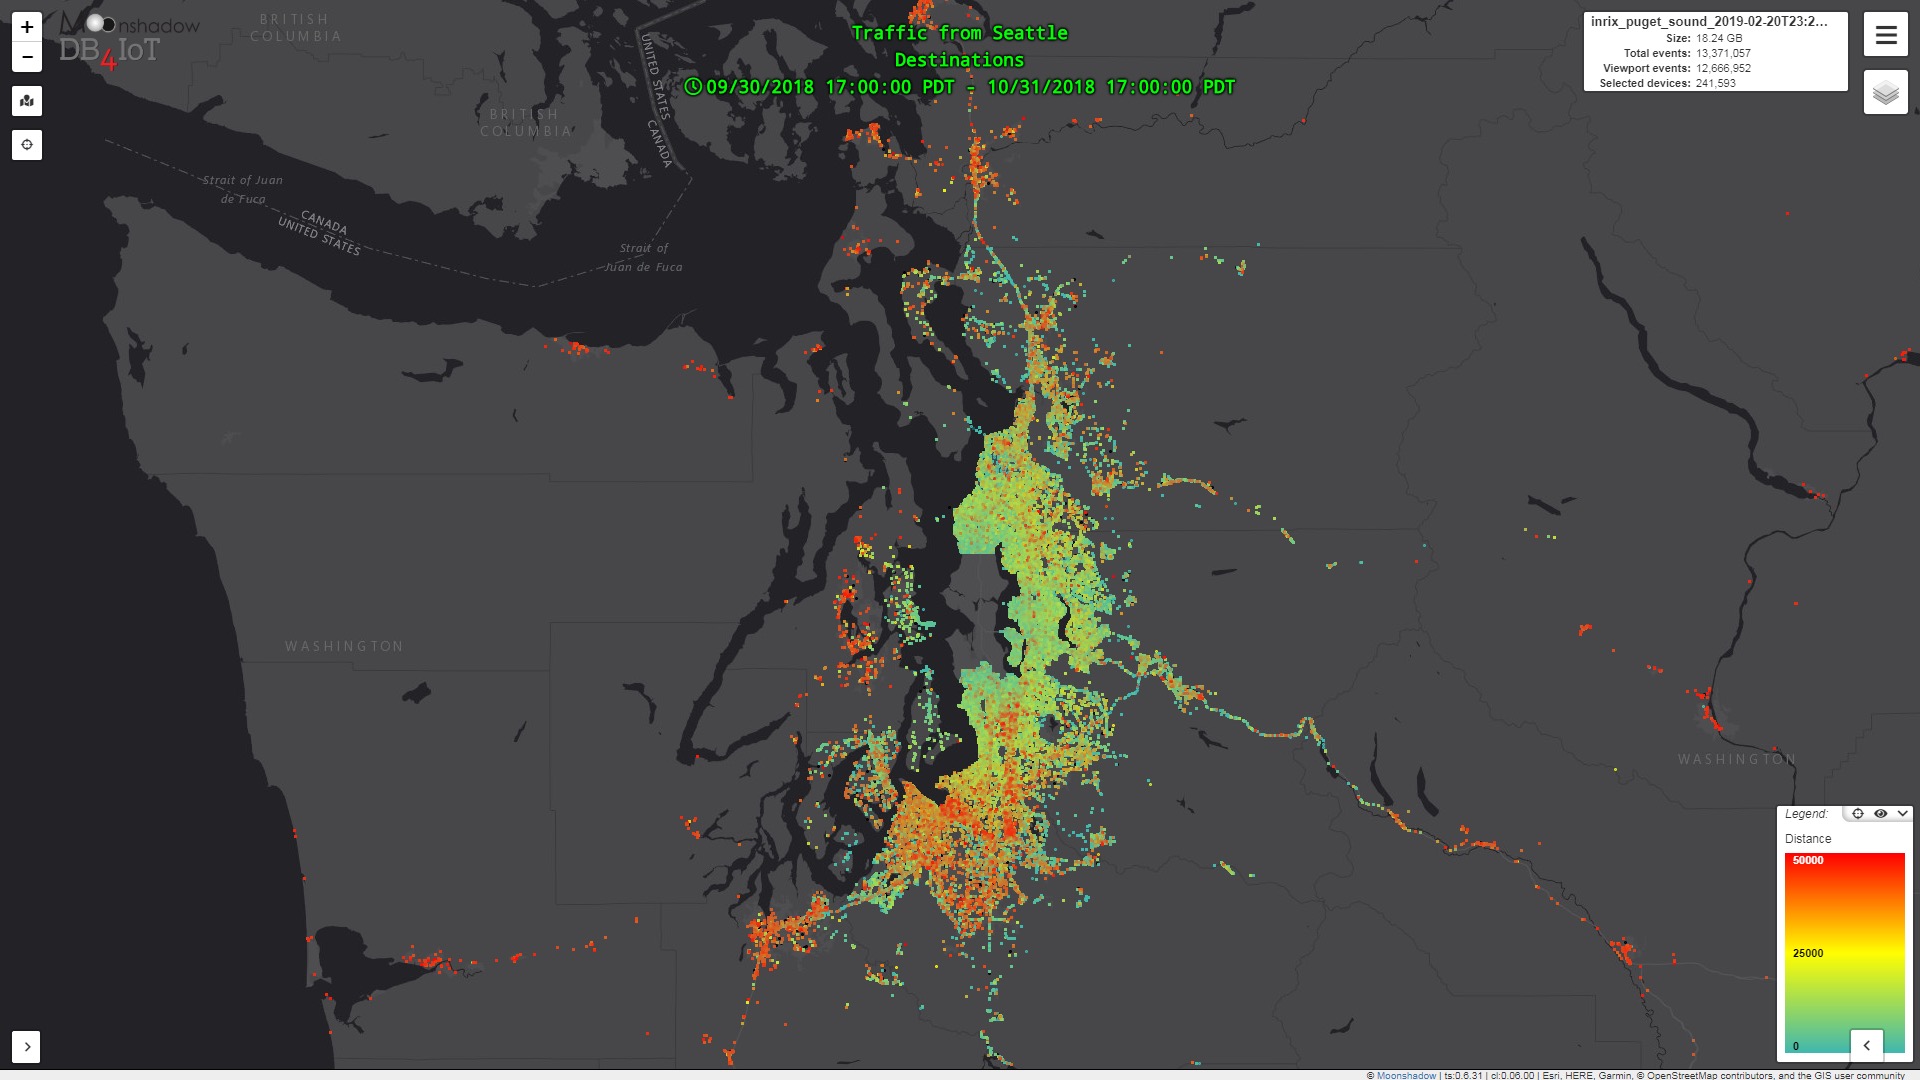
Map: Destinations by Distance Traveled. Community: Seattle, WA Year: 2018
All Times Transportation from your Community:
This map shows the location for all destinations for trips from Seattle as points. The point data is colored by the distance traveled from the origin of the trip. Destinations of trips that originate and terminate in Seattle are not shown. Those trips are calculated in the section for “All Times Transportation inside your Community.”
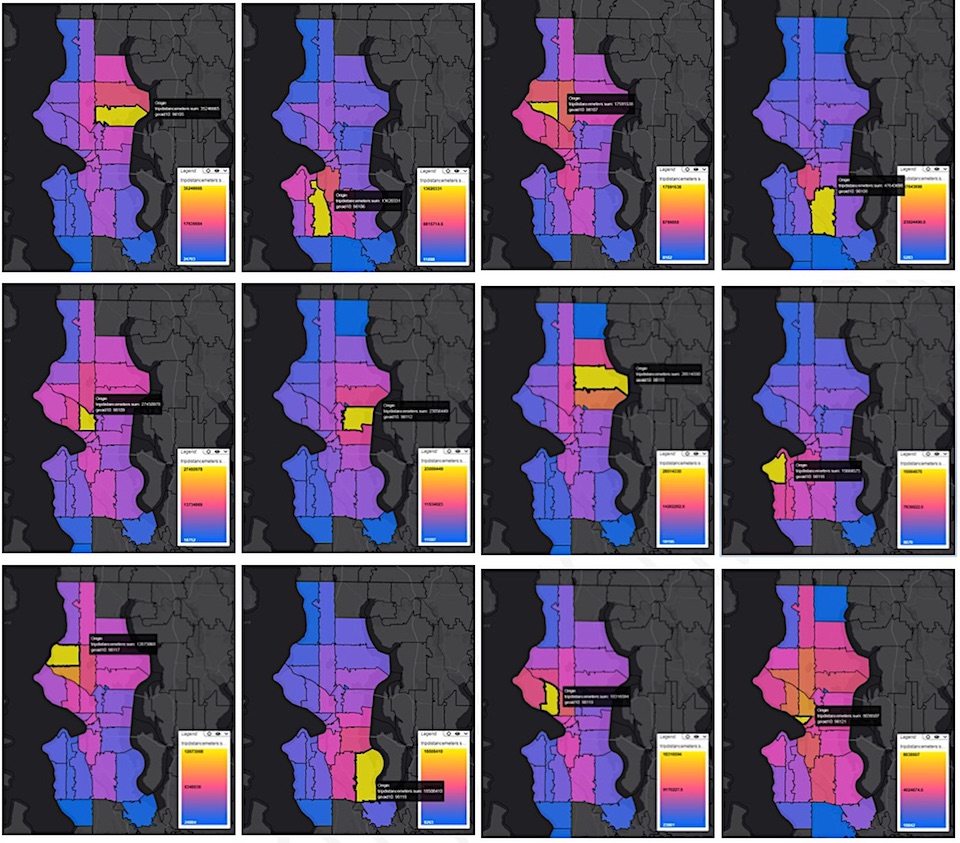
Map: OD Matrices per Zip (Postal) Code. Community: Seattle, WA Year: 2018
All Times Transportation inside your Community:
Vehicle Kilometers Traveled by Origin ZIP Code to the highlighted ZIP Code
Each of these maps show the relative Vehicle Kilometers Traveled (VKT) for traffic within the City of Seattle to a particular destination ZIP (Postal) Code (shown in yellow) Traffic in the City of Seattle is defined as any trip that has an origin and destination in Seattle regardless of whether a part of the trip takes place outside of the city boundary. The highlighted ZIP Code, which is usually shown in yellow, is the destination ZIP Code in each of the images. The black box shows the ZIP Code number for the destination ZIP Code. The other ZIP Codes are colored by their relative Vehicle Kilometers Traveled for traffic to the destination ZIP Code. The origin ZIP Codes with a low VKT are shown in blue and medium VKT cities are shown in purple and the highest are shown in yellow. For most ZIP Codes the VKT from traffic in the ZIP Code is the highest and therefore the selected destination ZIP Code is shown in yellow. Trips in a ZIP Code are defined as trips where both the origin and the destination are in the ZIP Code but the trip may go outside of the ZIP Code boundary.
DB4IoT Transportation Data for GHG Reporting also includes maps for the inverse traffic where the ZIP Codes are colored by the relative VKT generated by Destination ZIP Code from a highlighted Origin ZIP Code. The examples in this document show maps for both cities and ZIP Codes. With DB4IoT Transportation Data for GHG Reporting we can include maps and tables for other types of zones such as Neighborhood Maps, Census Tracts or TAZs. If customers provide Moonshadow with a shape file with their own map zones we can generate maps and tables using that zoning system.
Example Spreadsheets
All Times Transportation from your Community:
OD Pairs by City with Trip Count, VMT, Travel Time, Distance, Speed
Community: Seattle, WA Year: 2018

* Only top 5 rows of spreadsheet are shown, actual files will contain many more rows. Values shown are for product marketing purposes only and only represent trips within the data set.
All Times Transportation to your Community:
OD Pairs by City by Time of Day
Community: Seattle, WA Year: 2018

* Only top 5 rows of spreadsheet are shown, actual files will contain many more rows. Values shown are for product marketing purposes only.
All Times Transportation inside your Community:
Origin Destination Matrix by ZIP (Postal) Code for Vehicle Miles Traveled
Community: Seattle, WA Year: 2018
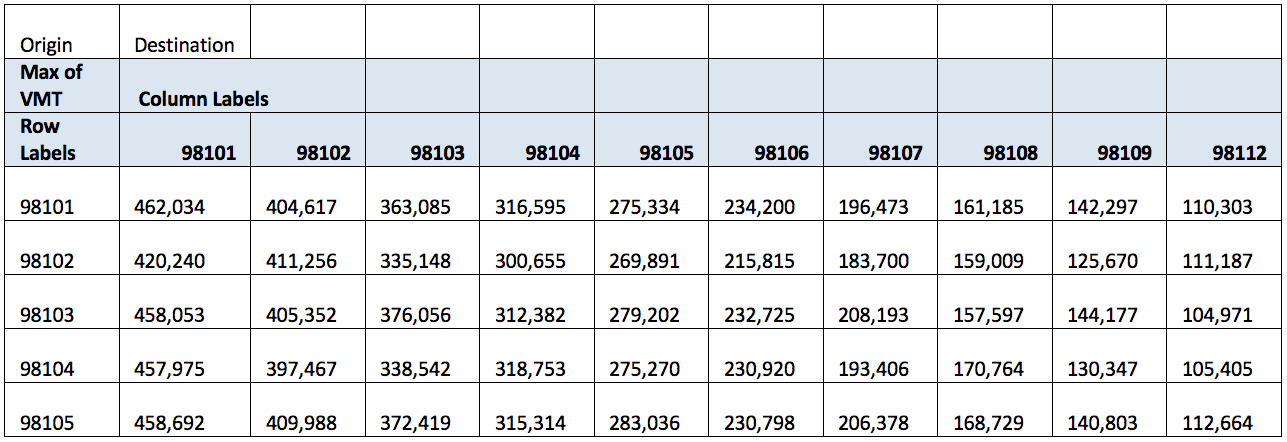
* Only top 5 rows of spreadsheet are shown, actual files will contain many more rows. Values shown are for product marketing purposes only.
All Times Transportation inside your Community:
OD (Origin-Destination) Pairs by ZIP (Postal) Code with Trip Count, VMT, Travel Time, Distance, Speed
Community: Seattle, WA Year: 2018

* Only top 6 rows of spreadsheet are shown, actual files will contain many more rows. Values shown are for product marketing purposes only.
Addendum: Data Sets
Overview
Anonymized connected-vehicle (CV) data provided by INRIX includes the origin and destination of each vehicle trip as well as many waypoints along the way. Exact timestamps are included, therefore we know exactly on what day and at what time each trip took place. By aggregating this data over time we get detailed insight about O/D patterns for time of day, day of the week and month of the year by vehicle class. We import CV data in our DB4IoT platform. The DB4IoT platform generates O/D matrices from the data set detailing travel time and vehicle miles traveled (VMT) or vehicle kilometers traveled (VKT) between cities, neighborhoods, ZIP Codes and TAZs. The data usually includes the speed of the vehicles as well.
Connected Vehicle Data
Our DB4IoT platform works with connected and floating vehicle data, this is data is used by the car navigation systems to determine the best route and estimate the time of arrival. These datasets are commercially available and Moonshadow will determine the best dataset for your area. Please email or call Moonshadow for information.
Location Based Service Data
In addition to connected vehicle data we use Location Based Service (LBS) Data that comes from smart phone apps. We use this data to augment the connected vehicle data or we use the LBS data instead of the connected vehicle data. For each project we use the data set that is best for the information requested. LBS data is far less precise but has in many cases (though not all cases) a higher penetration rate.* For city-to-city O/D matrices LBS data is often more suitable whereas for detailed studies connected vehicle data is often more suitable.
*The penetration rate of LBS data is usually provided as the number of devices per adult population, the penetration rate of connected vehicles is usually provided as the number of trips per total volume of trips. These numbers cannot be readily compared an LBS penetration rate of 40% can easily represent a trip penetration that is less than 5%.
Volume Counts
Not all vehicles are connected and INRIX data does not include the data from every connected vehicle. As a result, the INRIX waypoint data provides only a sample of all the vehicles. The INRIX Trips data, however, does give us a good indication of the distribution of traffic volume over the year on a minute- by-minute basis. For many road segments we have the AADT or ADT and we have the number of vehicles (trips, actually) that were reported in the INRIX Trips data. As a result, we can determine the sample size and the multiplication factor that should be used to scale up to the full traffic volume for those segments. Similarly, we can scale up the data that comes from LBS providers.
If your community has traffic counts per road segment we can look at using this to determine the sample size and calculate the multiplication factor. Call or email us for additional information.