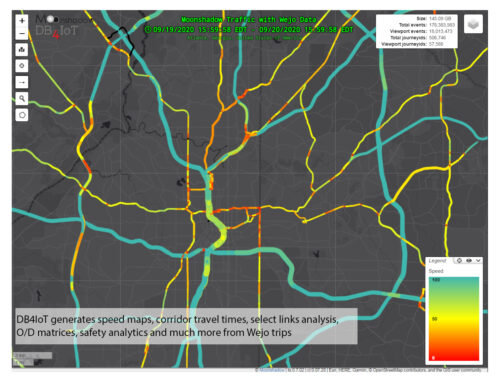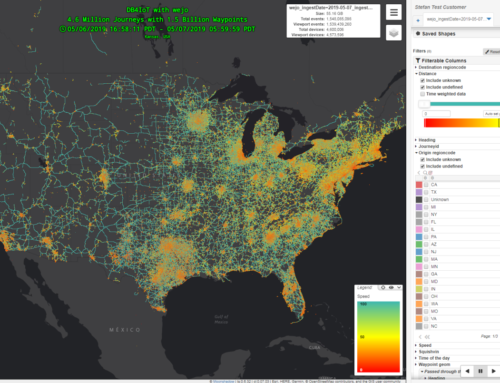
Moonshadow Mobile, Inc. has developed Moonshadow Live Traffic, powered by Wejo Ltd’s real-time connected vehicle data, to give traffic managers access to maps that show the traffic situation for any area in the US with a latency of 30 seconds or less.
Moonshadow Live Traffic is a break-through in both speed and accuracy for real-time traffic data by using Wejo connected vehicle data from over 10 million vehicles in the US. The Michigan Department of Transportation (MDOT) recently issued an RFP that includes some key performance indicators (KPI’s) for real-time traffic data. Moonshadow Live Traffic beats most KPI’s by a factor of 10 or more.
 Figure 1. Moonshadow Live Traffic exceeds MDOT Requirements by 6-12x
Arguably the most important KPI for real-time traffic data is latency; the time it takes for data to be turned into usable information for traffic managers. MDOT required a maximum latency of 600 seconds; Moonshadow Live Traffic with Wejo data offers a service level agreement (SLA) with a 90 second maximum latency for 95% of the vehicle data. MDOT specified that it preferred a maximum latency of 300 seconds; Moonshadow Live Traffic delivers maps and tables with a latency of less than 30 seconds for 95% of the data. MDOT also required that the data must be updated once every minute. Moonshadow Live Traffic data is updated every second and maps showing tens of thousands of vehicles are generated in just a few seconds resulting in an update interval of five seconds or less. The MDOT RFP specified that maps need to show speed and congestion per road segment, or per mile for road segments that are longer than a mile. Wejo receives an update from each of the 10+ million vehicles every three seconds with a three meter precision. Moonshadow Live Traffic preserves this level of precision and its maps show the exact location where traffic is congested and how it affects other roads.
 Figure 2. Moonshadow Live Traffic can track and visualize hundreds of thousands of vehicles in real time
Moonshadow Live Traffic is a fully interactive online application that runs in a web browser. Traffic managers can look at the traffic for an entire city and automatically refresh the data every second to keep a constant overview of the activity on their road network. Figure 2 shows the location of 80,000 vehicles by their speed in San Antonio. Moonshadow Live Traffic can update an image like this once a second. Traffic managers can zoom in on any area to look at traffic in detail overlaid on satellite imagery or maps to view differences between lanes. Moonshadow Live Traffic can open multiple windows to let managers keep an overview while they are looking at specific intersections. They can go back in time and play back the movement to see how the congestion is developing in an animation. The live traffic situation can also be compared to historic data to see how the current moment compares to the same time on similar days. Dozens of traffic managers can be logged in to Moonshadow Live Traffic to look at real time maps simultaneously. Users can watch traffic movement on a laptop while they are out in the field as long as they have Internet access.
 Figure 3. Moonshadow Live Traffic can show the movement of vehicles per lane
Moonshadow Live Traffic is based on DB4IoT (www.db4iot.com ), Moonshadow’s mobility analytics platform, and is provided as a Platform as a Service (PaaS) that can be accessed from a web browser. All data is stored by Moonshadow in the cloud and there is no need for IT staff to bring up servers or process the enormous data sets. Moonshadow Live Traffic can be used as a stand-alone system or it can be integrated into existing systems for traffic management. Moonshadow has APIs available to enable software developers to include maps and data from Moonshadow Live Traffic in their own mobility analytics applications and transportation dashboards.


