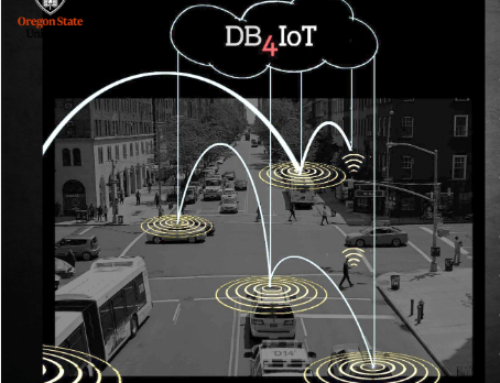
Wejo organizes billions of waypoints every day
Moonshadow Mobile, Inc. and Wejo Ltd, have teamed up to offer DB4IoT with wejo journey data. Wejo is the trusted connected car data partner for global OEMs, with 14 million active passenger vehicles on its platform that generate 17 billion waypoints every day. On May 20, wejo introduced Moonshadow as the first wejo Data Insight Partner in the world in a webinar. A video of the webinar can be viewed here:
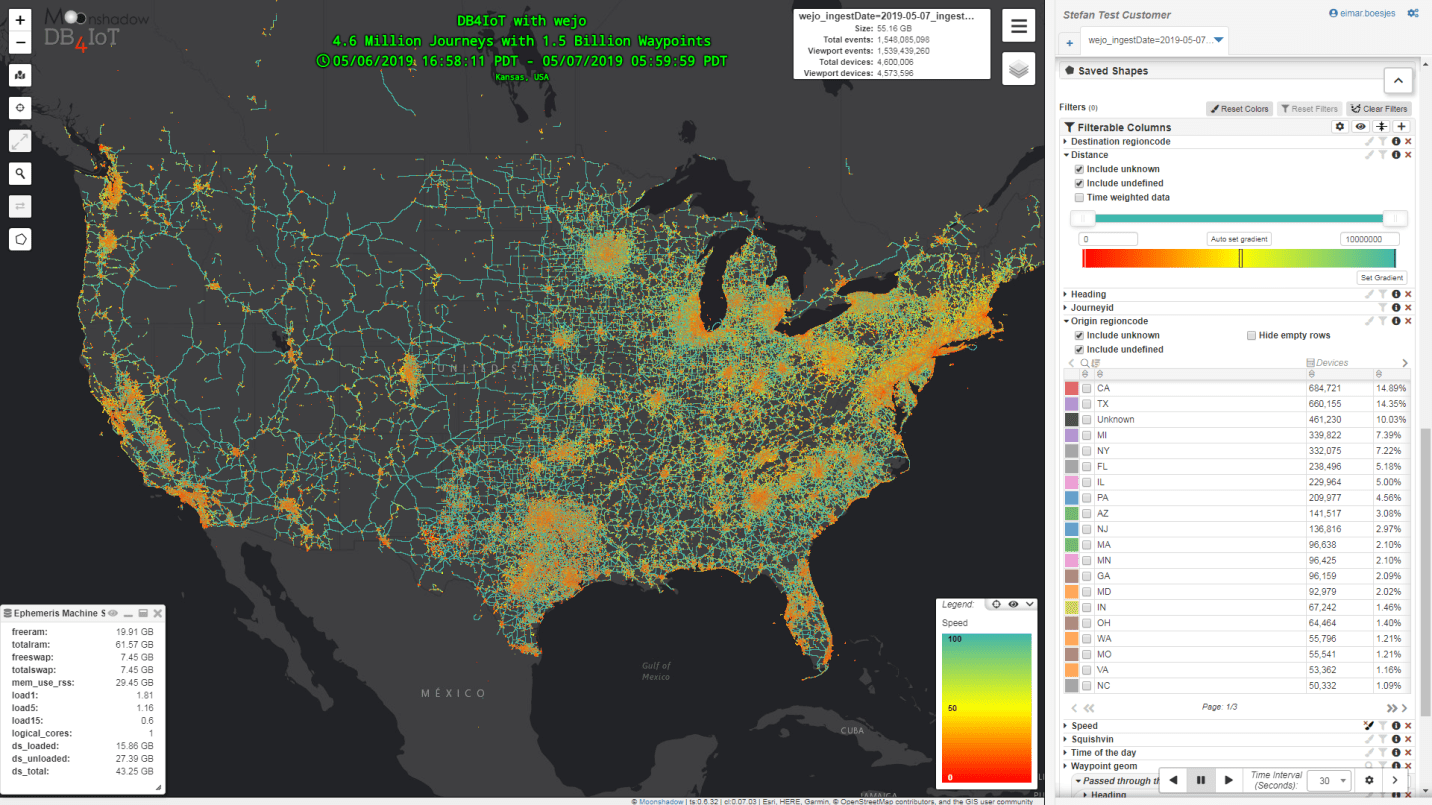 Fig 1. DB4IoT with Wejo data is available for any area in the US
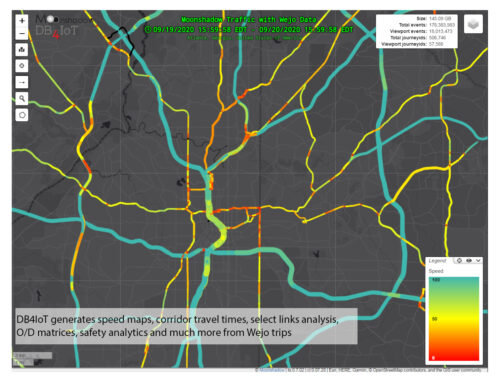
DB4IoT with Wejo journey data is provided as a Platform as a Service (PaaS). There is no software to install to use DB4IoT. A map-based user interface in a web browser allows you to zoom in on any area to perform transportation analytics and Wejo data is pre-loaded in DB4IoT. Since Wejo receives data from vehicles every three seconds the data sets are very detailed and very large; a typical database can contain billions of waypoints. These giant databases run on Moonshadow’s servers in the cloud so IT staff does not need to procure servers or load data.
 Fig 2. DB4IoT with Wejo data can visualize the original probe points
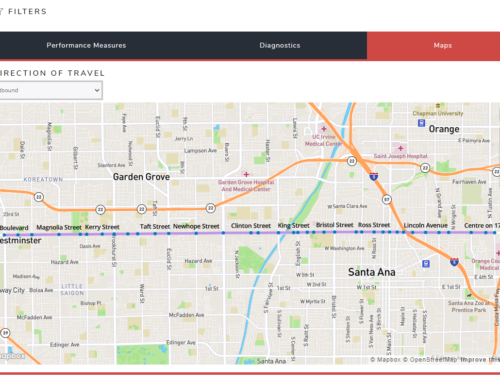
Moonshadow enriches Wejo journey data to facilitate transportation analytics. We add selectors for the DayOfTheWeek and TimeOfDay to make it easy to specify peak periods on weekdays, for instance. DB4IoT also snaps all waypoints onto the OpenStreetMaps road network. This allows transportation engineers to do quick selections by just clicking on a road segment in DB4IoT.
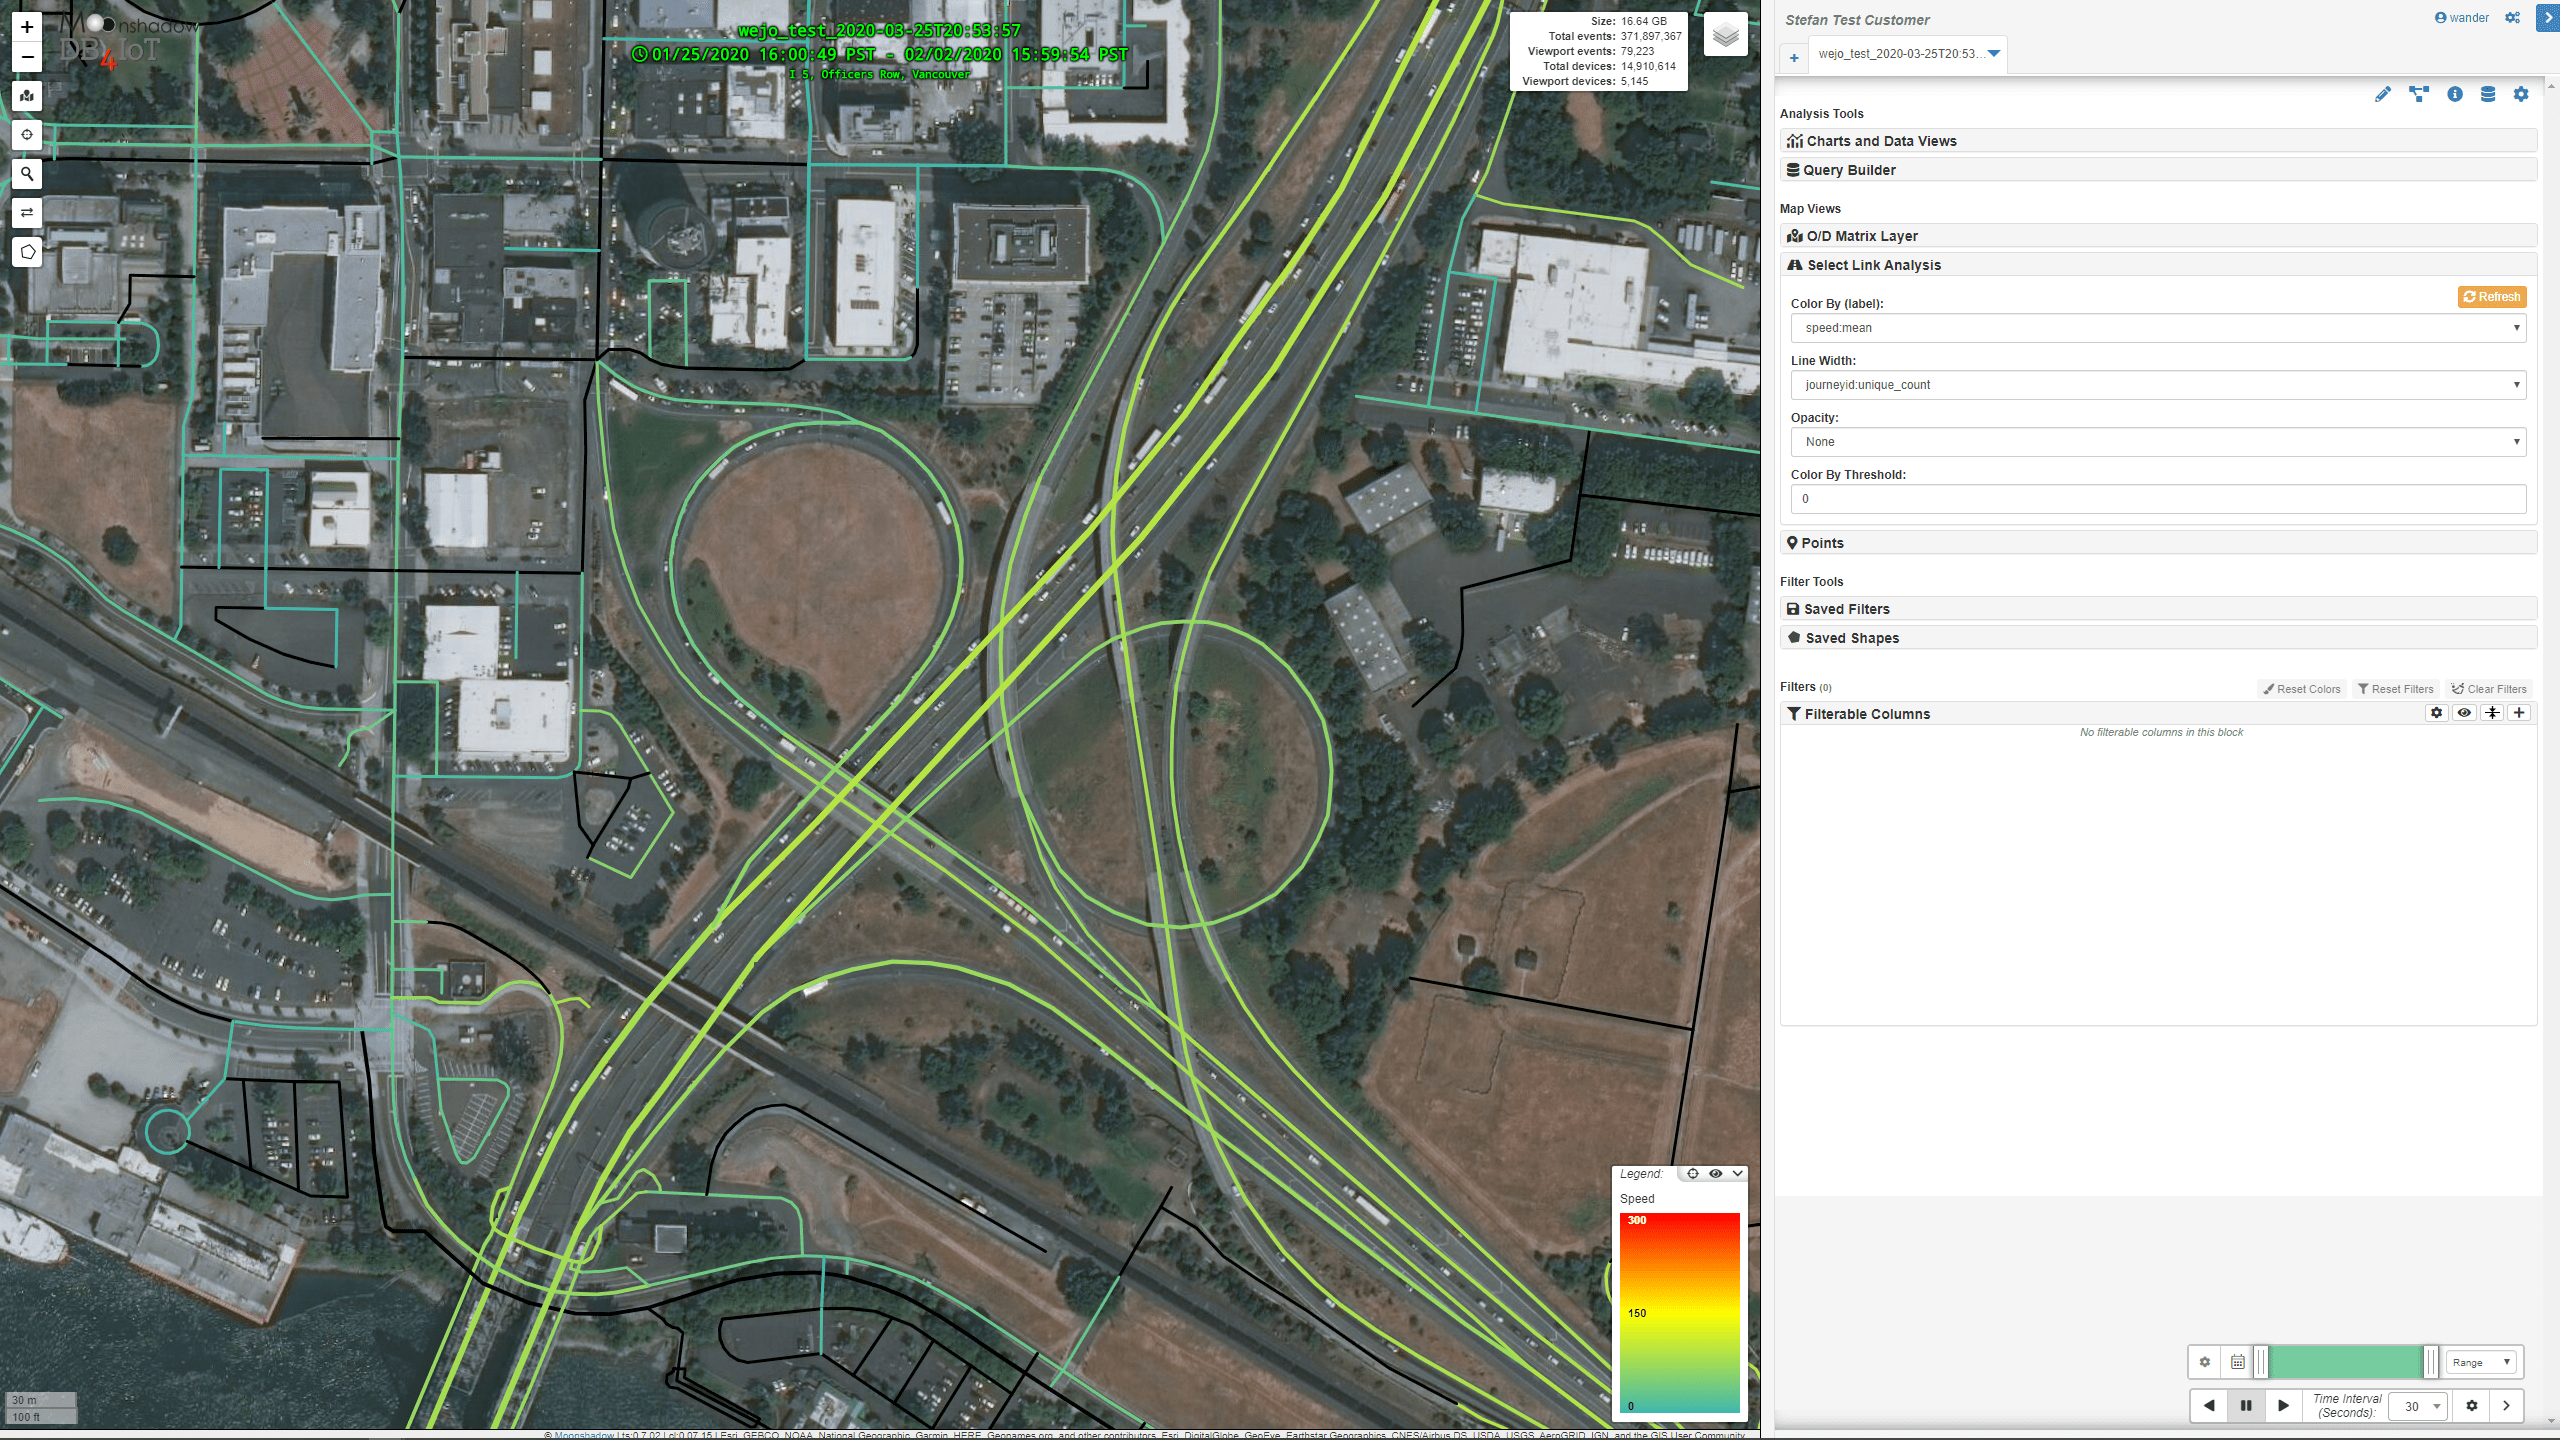
Fig 3. DB4IoT with Wejo data snaps all traffic to road segments
Wejo’s precision enables new use cases
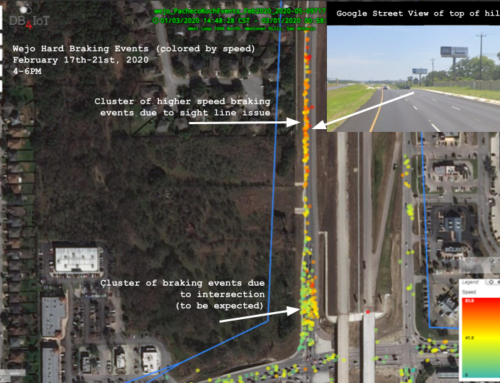
Wejo receives an update from every connected vehicle every three seconds. In the image below the data is visualized by speed with the slowest speeds in red and the highest in blue. The image shows that the probe points are further apart the higher the speeds, which is exactly what you would expect. Because of its detail Wejo data can be used for analyses that can’t be done with other data sources.
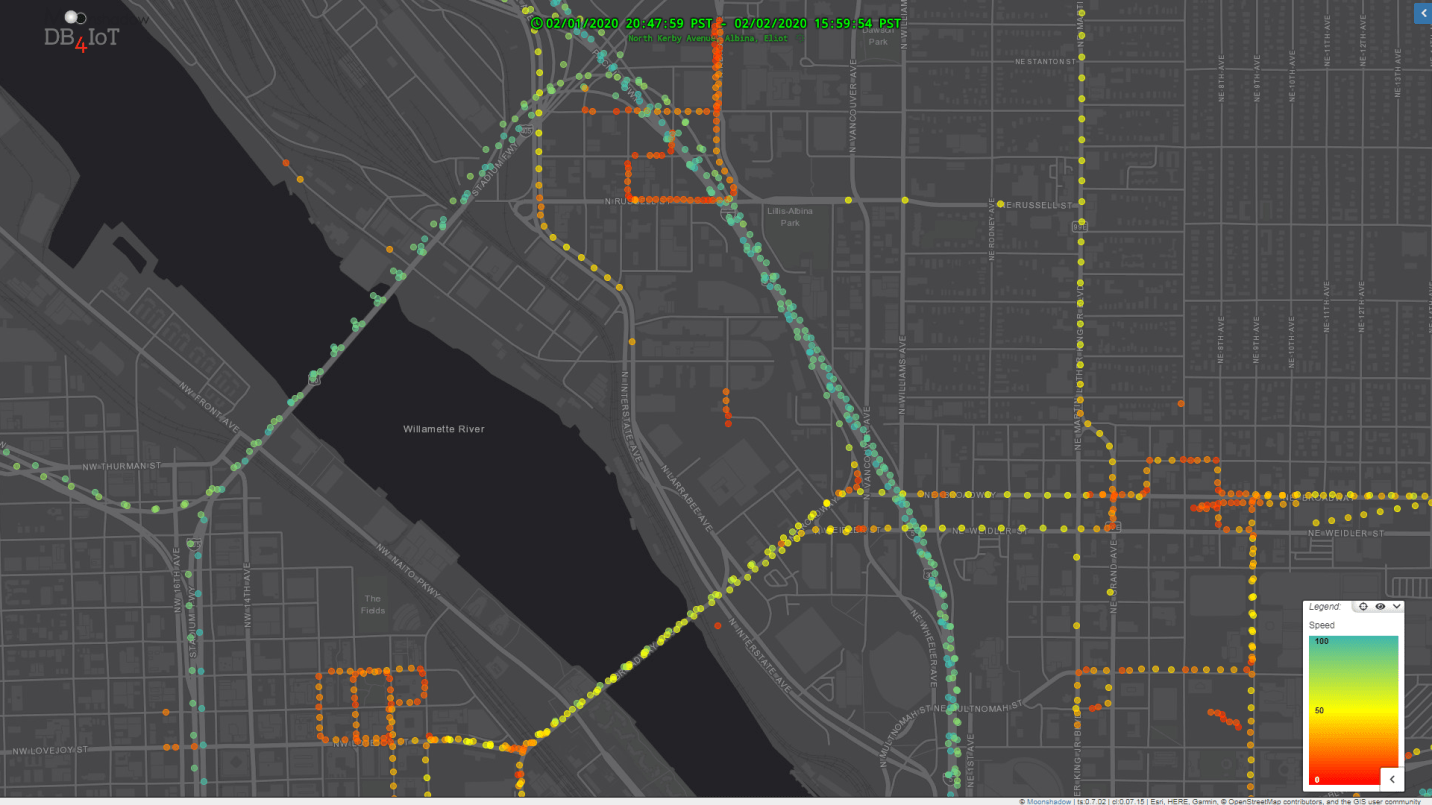 Fig 4. Wejo collects a point every three seconds
Some low frequency Location Based Services (LBS) data providers collect 10-20 points per device per day. From this data you cannot determine trips and it has very limited use for transportation analytics. High-frequency LBS providers typically collect a point every 2-10 minutes. With this data you can generate reliable Origin/Destination data for entire trips. The exact trajectory is not known but it can be approximated using routing engines. This results in a data set that is a combination of probe data and modeled data. The longer the interval time between vehicle updates the lower the certainty that the assumed route is correct, especially in areas with parallel streets where alternative routes are possible. Providers of LBS data often claim that they receive data from 30% or more of the adult population. The vast majority of this data, however, cannot be used for transportation analytics and it is removed. The result is a datasets that often includes fewer than 5% of the trips. This is lower than what most connected vehicle providers track. Low frequency connected vehicle data comes in at a higher frequency than LBS data but it still does not receive a location update on every road segment. The missing links can be filled in using routing engines. This is much more exact than the route finding on 2-10 minute interval data as only a few road segments are skipped each time. Low frequency CV data can be used well for Origin/Destination analysis and it also provides good speed and travel time estimates for road segments. It can, however, not be used to look at speed changes within a road segment.
The table in Fig. 5 provides an overview of how these different data sources support transportation analytics.
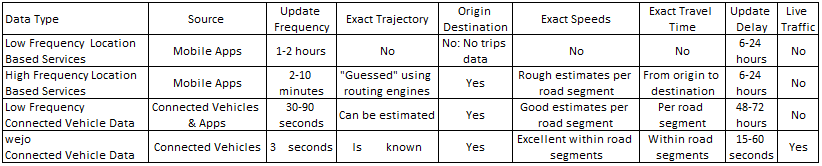 Fig 5. The update frequency determines how probe data can be used.
The table shows that Wejo journey data is in a class by itself. The O/D information is more precise but where it really shines is in detailed analysis. Whereas individual travel times on 30-90 second interval data has a maximum precision of, exactly, 30-90 seconds, Wejo data can determine travel times up to three seconds. With Wejo, we can look at speed differences within a road segment which is simply not possible with any of the other data sources. There is another area where Wejo sets itself apart. Many LBS providers can deliver data with a delay of 6 hours. Most connected vehicle providers, however, need 48-72 hours to receive, enhance and deliver the data to customers. Wejo data is available in near real-time. DB4IoT can show current traffic conditions within minutes which makes it a powerful tool for traffic management. Because of the 3-second precision we can see exactly where traffic is backing up as a result of an incident – within minutes of this happening. DB4IoT can combine the historical data with the live feeds and as a result traffic engineers can quickly compare how current road conditions differ from similar days.
Select Link & O/D
DB4IoT features a number of transportation analytics functions. In the images below the yellow road segment has been selected as a pass-through filter in the Westbound direction by simply clicking on the road segment. The data is colored by the number of trips on each road from blue for the lowest traffic volume to yellow with the highest volume. The image on the left shows where traffic is going to and the image on the right where it is coming from.
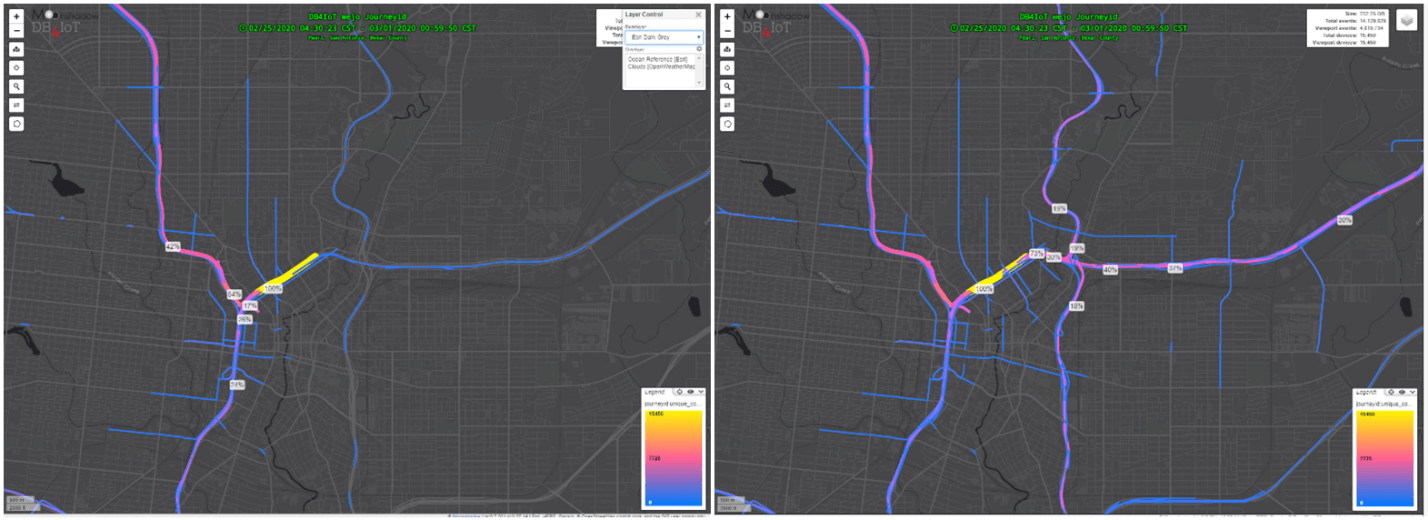 Fig 6. DB4IoT shows where traffic is going to (left) or where it is coming from (right)
The pass-through filter can be combined with any other filter in DB4IoT. We can, for instance, look at weekday morning peak traffic for the last month and combine this with an origin polygon filter.
 Fig 7. An Origin/Destination table is generated after selecting a link
After selecting a road segment DB4IoT can generate Origin/Destination information for counties, cities, ZIP-codes, TAZs or Census Tracts. There is no limit to the number of zones. In the example above we generated O/D information from city to city for traffic driving through the selected road segment shown in yellow during the weekday morning peak over a month. The O/D data can be exported as a CSV with just another click. Apart from the traffic volume count we can also include other data in the table such as the travel time mean or speed mean.
Data + Analytics = Insights
Wejo fulfills an essential role in organizing connected vehicle data from OEMs and making it available to DOTs and transportation engineers. The data, however, is so large and comes in at such a speed that it can be a challenge to process and store it. After the data is stored it can be a challenge to run queries against databases with billions of records. What’s more, the types of queries that transportation engineers need can be complex to write and can take hours to run. To generate the Origin/Destination table in the example above a seasoned database engineer will first need to select all trips that pass-through a spatial filter (the road segment), then define all weekday morning peak periods for a month in Unix timestamps, find the origins and waypoints of each selected trip, map every origin and destination latitude/longitude pair to the geographical boundary shape file that defines the cities and then group the results. This is no easy task.
DB4IoT has built-in functionality to run these complex queries and it runs on a proprietary database engine that was developed specifically for connected vehicle data. Hours of data wrangling and database engineering to write complex SQL statements are now reduced to clicking the right filters. This means that transportation engineers can immediately focus on their core competency; what does the data tell us about movement patterns.
Wejo recognized that their clients need insights, not data, and they created the wejo Data Insights Partner program. We are thrilled that Wejo selected Moonshadow, with the DB4IoT Mobility Analytics Platform, as their first partner.