
![]() DB4IoT with INRIX Trips is a joint offering from INRIX and Moonshadow that combines INRIX Trips data with Moonshadow’s DB4IoT database engine to power an intuitive, cloud-based, interactive trips analytics platform. The combined solution enables customers to quickly find, filter and interact with the data needed for a specific project and provides fast insights into the trips people make (origin-destination) over time on maps, charts and graphs.
DB4IoT with INRIX Trips is a joint offering from INRIX and Moonshadow that combines INRIX Trips data with Moonshadow’s DB4IoT database engine to power an intuitive, cloud-based, interactive trips analytics platform. The combined solution enables customers to quickly find, filter and interact with the data needed for a specific project and provides fast insights into the trips people make (origin-destination) over time on maps, charts and graphs.
There’s no longer a need to conduct expensive, manual studies or rely on preconfigured tools to understand the trips people make along your roadways. Using INRIX Trips along with DB4IoT, you have complete insight. DB4IoT with INRIX Trips can easily and accurately visualize and study travel patterns over time on maps, charts and graphs.
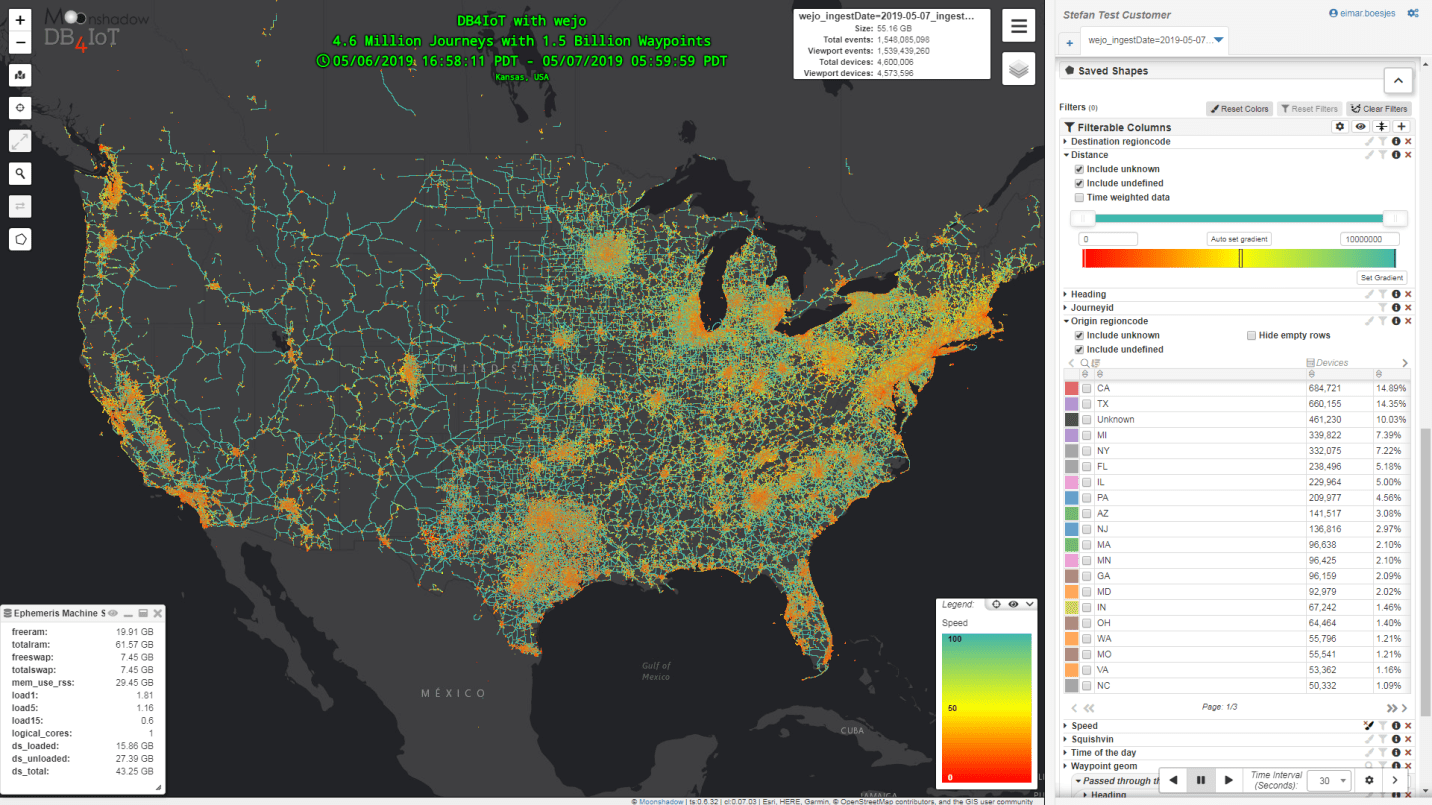
Vehicle speed of 200M INRIX waypoints visualized in DB4IOT with time chart
Flexibility to study INRIX Trips on your own terms
INRIX Trips + DB4IoT provides you with raw data and visualizations to analyze scenarios quickly without the restrictions of pre-defined models. You can easily filter and manipulate the data in a variety of ways to analyze different scenarios. Quickly generate analytics maps, charts, graphs or animations to bring your presentations to life.
No additional equipment or support required
DB4IoT with INRIX Trips provides planners and traffic engineers with access to the data without having to rely on IT staff or database engineers. Because the solution is cloud-based, there is no need to store and process large INRIX Trip data on your own computers. Easily export project data to import into other analytical tools you already use.
Downtown Portland INRIX waypoints visualized in DB4IOT with time chart
Complete insight into the INRIX Trips data
Other solutions provide access to aggregated data only and don’t disclose how these aggregations are put together, making it necessary for traffic engineers to rely on a “black box” of data for their analysis. INRIX Trips and DB4IoT provides access to the raw, anonymized data so you can understand the data behind the visualizations and detect anomalies that may impact your analysis.
Intuitive, easy-to-use browser interface
Filter, select and download raw trips records or matrices for offline analysis from DB4IoT’s intuitive point-and-click, map-based user interface. Easily create maps, charts and graphs for use in reports and presentations. Create movement animations. Fully interactive map that allows switching between different street and satellite map layers.
Vehicle speed of 200M INRIX waypoints visualized in DB4IOT with heat chart
DB4IoT delivers faster, more accurate analysis
DB4IoT is a noSQL columnar store that does not require compression/decompression, giving it the ability to traverse very large databases extremely quickly. View maps, charts, histograms, graphs and heat charts instantly, over time and space, to analyze data and identify data inaccuracies.DB4IoT visualizes an INRIX Trips database with tens of millions of trip records on maps within seconds.
Compatible with data from many software solutions and file formats
DB4IoT can integrate a variety of data sources including INRIX Trips, Transit data, Fleet data, Census data, demographics and more. Easily Combine INRIX Trips data with data from other sources or modes, including your own data.
INRIX Trips provides the most complete view of actual observed trips drivers take, including anonymized starts and ends of their journeys and the waypoints in between. Trips insight is derived from industry-leading geospatial data processing, which enables new understanding of population movement information such as origin and destination zones, diversion routes during peak time and incidents, corridor usage and more.
Generate Origin-Destination Matrices in Seconds
DB4IoT with INRIX Trips delivers the capability to generate Origin-Destination matrices from databases with hundreds of millions of waypoint records within seconds. This makes generating O/D matrices an interactive process. Users can change the time periods, date range or vehicle types and DB4IoT generates the O/D matrix automatically. This video shows how quick and easy it is to generate an O/D matrix in DB4IoT with INRIX Trips.
- Analyze traffic movement during peak time and incidents
- Understand population movement information such as origin and destination matrices based on different types of zone meshes
- Track trends and accurately calibrate models to make better-informed decisions for transportation network investments
- nalyze diversion routes during peak time and incidents, corridor usage and more
- Analyze and visualize multi-modal datasets on maps, charts and graphs
- Combine INRIX Trips data with your data
- Quickly download the INRIX Trips data needed for a specific project