On June 5th at ITS America in Washington DC, Moonshadow CEO, Eimar Boesjes, delivered a presentation titled “Introducing the O/D CO2 Matrix Using Connected Vehicle Data to Reduce Greenhouse Gas Emissions” at a technical session and panel discussion.
Millions of connected vehicles generate detailed movement data. After anonymizing the data it can be used to gain insight into the movement patterns of vehicles as well as which movements generate the most greenhouse gas (GHG) emissions.
Anonymized connected vehicle data includes the origin, destination and waypoints of trips. Timestamps give us the day and time for each point. By aggregating this data over time, we can derive detailed insights about O/D (Origin/Destination) patterns over the time of day and day of the week by vehicle type. With connected vehicle data we can generate detailed O/D matrices that reveal travel demand and VMT (Vehicle Miles Traveled) between cities, neighborhoods, Zip Codes or TAZs. Using vehicle speeds allows us to make an estimate of the emissions that result from these trips. This means we can generate O/D CO2 matrices. After adding in the Average Annual Daily Traffic (AADT) we can scale up the connected vehicle sample to an estimate of the total CO2 emissions in order to generate detailed O/D CO2 matrices to estimate all CO2 output that results from traffic between zones.
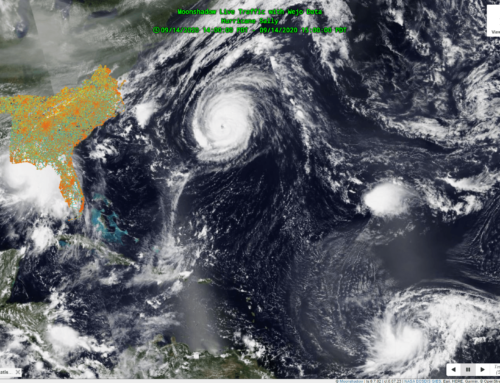
We implemented a proof of concept of this methodology for the Puget Sound area of Washington State using one month of data from 3.7 million trips with 135 million waypoints to validate our methodology. Full GHG inventory reports will typically look at a full year. By comparing O/D CO2 matrices from different years we get detailed insights into which changes in travel patterns are increasing or reducing CO2 output.