Each week the buses and trains of the New York City Metropolitan Transportation Authority (MTA) make over 150,000 trips. We thought it would be fun to visualize all these trips in an “animated map application”.
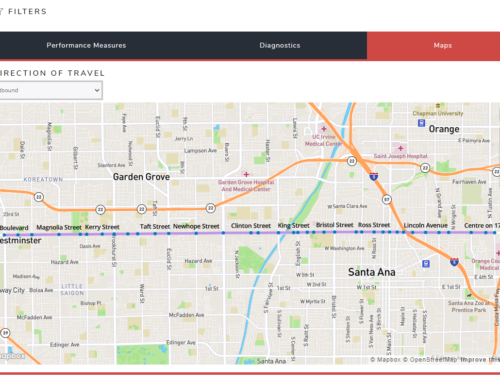
The MTA animated map application shows the scheduled location of every bus and subway train at any time during the week over a map. You can zoom out to look at the entire MTA service area from Staten Island to the Bronx and Manhattan to Queens. When zoomed out you will see thousands of moving vehicles depending on the time of day. You can also zoom in on any part of the city to see the movement on a few bus or subway lines in detail. With the time slider control at the bottom of the screen you may choose any moment in the week to see the location of all buses and trains at that point in time. Select the play button (“>”) to see the movement of all vehicles in an animation. With the time interval control you can set the speed of the animation. Most browsers will update the screen in 1-2 seconds so if you set the speed to 120 seconds you will see the movement of two minutes every 1-2 seconds. A 30-minute trip will now play as an animation in 15-30 seconds on your screen.
You can filter by a single bus or subway line to view only the movement of the vehicles on that line. In the “Label Field” in the side panel you can choose to display a label for each moving object. You can display the next stop name, stop number, line number or head sign. When you are zoomed in you can click on a vehicle to view detailed trip information. When you first open the animation application the trains and buses are colored by their ‘route-type’. Subway trains are displayed in orange and buses are shown in red. Click on the paintbrush to the left of the ‘route-id’ in the side panel to color all vehicles by their route number. By default the MTA animation application shows both directions of every route. Use the ‘direction-id’ filter in the side panel to show only one direction (‘0’) or the other (‘1’).
The MTA animated map application is not meant as a tool to find your way around New York. Google Maps and many other applications solve that problem very elegantly. The animation application is a great visual tool to look at vehicle movements and service patterns.
The animated map application was created in the following way. The MTA publishes its schedule as a GTFS file. Moonshadow used the MTA schedule to calculate the scheduled location of every bus and train every 10 seconds for a full week. We used the schedule for October 2 through October 9, 2016. We stored the position of every vehicle in every trip in DB4IoT. The MTA animation application shows the location where every bus or train is supposed to be according to the schedule. It does not show the actual location where each bus or train was at any moment in time. For TriMet in Portland, Oregon we have created an animation application that shows the actual location of every TriMet bus and light rail since August 16, 2016. You can find this application at the following URL:
DB4IoT is a database engine that was specifically developed by Moonshadow to store the movement of objects over time for the Internet of Moving Things and it is very efficient in storing ‘time-series’ geospatial data. The retrieval speeds in DB4IoT are so fast that we can generate animations of hundreds of thousands of moving objects. The MTA animated map application is running on a single server in the cloud. It uses two different animation modes; smooth animations and image animations. Smooth animations are generated in the browser on your computer and image animations are generated on the DB4IoT server in the cloud.
The number of objects that can be animated on your screen depends on your computer hardware and the web browser you are using. For Chrome, Firefox and Safari on most computers the limit is about 1,500 moving objects. For mobile devices the limit for smooth animations is much lower. Once the number of objects exceeds this limit DB4IoT will automatically switch to image animations. In image animations each image in the animation is created on the DB4IoT server and sent to the browser. The MTA animated map application will automatically switch between these two animation types as you go over or under the threshold. You can click on the moving objects to retrieve data only when smooth animations are shown.
Any GTFS schedule anywhere in the world can be visualized in DB4IoT as an animated map application. Please let us know if you are interested in having your GTFS schedule published as an animated map application. You can also contact Moonshadow if you have the need to track any type of moving assets over time.