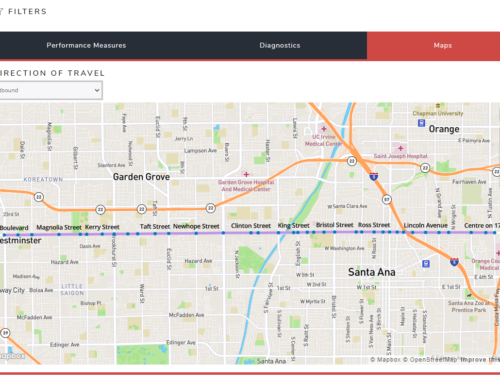
TriMet provides bus, light rail and commuter rail transit services in the Portland, Oregon, metro area. This video shows the movement of every Portland Trimet bus, rail and tram for a 24-hour period starting at 3:30 a.m. on Wednesday, September 7, 2016 through 3:30 a.m. on Thursday, September 8, 2016. At 4:00 a.m. there are a few bus routes running. You can see how the number of buses starts to grow quickly around 6:00 a.m. and is reduced at 10:00 a.m. There is an increase again during the afternoon peak. In the evening the number of buses running is slowly decreased until around 3:00 a.m. when only one bus is remaining.
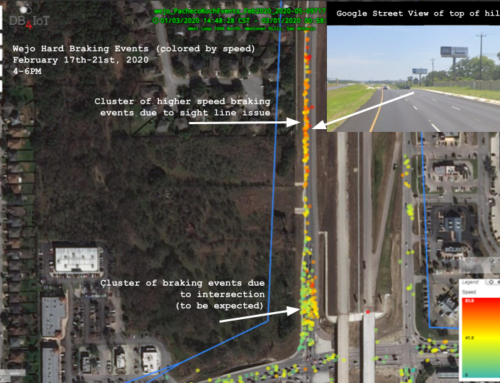
Here’s how the video was created. This video is not using the Trimet bus and lightrail schedule but it is using actual location data from September 7, 2016. All TriMet buses are equipped with GPS sensors that record the bus location and many other measurements. All of this data is sent from each bus to TriMet’s servers on the Internet once every 10 seconds. TriMet makes this available as a live data stream to the public. Moonshadow has developed a database engine, DB4IoT, specifically for working with large numbers of moving objects that report their locations and sensor measurements at a high frequency. Moonshadow downloads the TriMet data every ten seconds and stores it. DB4IoT can generate map, location and sensor data at very high speeds. Because the database technology is so fast it can generate maps with objects that are moving. In DB4IoT you can go back to any point in time and start playing the bus and tram movement as an animation. This animation was created by playing back the location of every bus in DB4IoT for the 24-hour period starting at 3:30 a.m. on Wednesday, September 7, 2016. The video was sped up slightly to fit into three minutes.
The buses not only report their location but they also have sensors to report on many other aspects of the bus. One of the measurements that each bus tracks is the number of people in the bus. This is shown as the ‘loadPercentage’. The graph shows the average loadPercentage in all buses over the 24-hour period. The graph also shows the average delay of all buses. The moving dotted line displays the exact point in time that is shown on the map.
DB4IoT can keep track of the location and sensor data of tens of thousands of objects simultaneously. You can include hundreds of different sensor measurements with each object. DB4IoT can accept data streams from GPS sensors as well as from mobile apps. Moonshadow can provide the mobile apps on iPhone or Android devices for your organization or use your own location services enabled mobile app.

